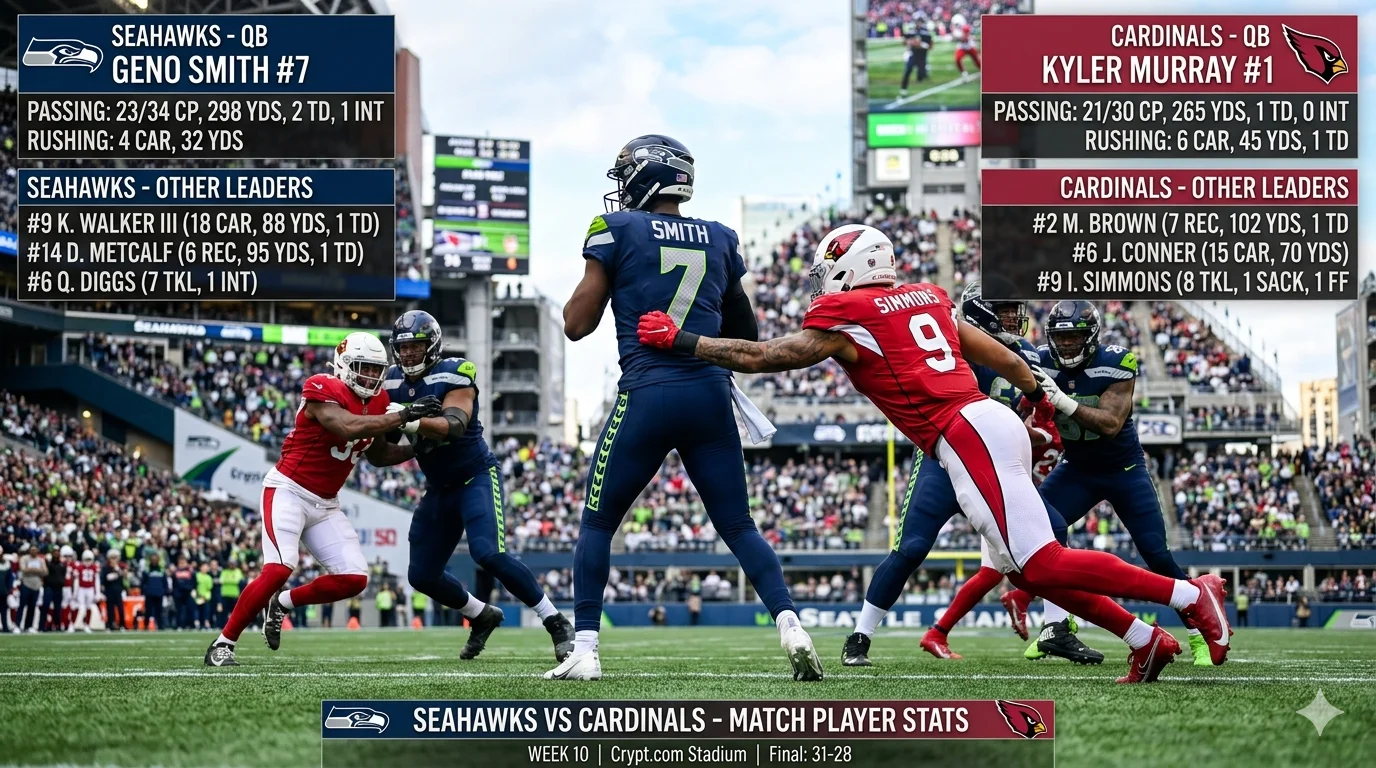
Seahawks vs Arizona Cardinals Match Player Stats
Did the Seahawks Own the Cardinals in 2025? Here Are All the Stats
The Seattle Seahawks and Arizona Cardinals played twice in the 2025 NFL season. Game 1 in late September was a nail-biter that Seattle survived with a last-second field goal. Game 2 in November was a completely different story — an absolute blowout. If you want every detail from the seahawks vs arizona cardinals match player stats across both contests, this is the only breakdown you need.
Both games are fully covered here: scoring plays, team stats, key individual performances, and the strategic factors that separated the winners from the losers.
Quick Results: Seahawks vs Cardinals 2025 Season Series
| Game | Date | Location | Score | Winner |
|---|---|---|---|---|
| Game 1 — Week 4 | Sept 25, 2025 | State Farm Stadium, ARI | ARI 20 – SEA 23 | Seahawks |
| Game 2 — Week 10 | Nov 9, 2025 | Lumen Field, SEA | SEA 44 – ARI 22 | Seahawks |
Seattle swept the series. The margin in Game 1 was a 52-yard Jason Myers field goal with 4 seconds left. The margin in Game 2 was 22 points — and it wasn’t even that close at halftime.
Game 1 Full Breakdown — ARI 20 vs SEA 23 (Thursday Night Football)
Date: September 25, 2025 | Venue: State Farm Stadium, Glendale, AZ Broadcast: Thursday Night Football
Quarter-by-Quarter Scores — Game 1
| Quarter | ARI (Cardinals) | SEA (Seahawks) |
|---|---|---|
| Q1 | 3 | 7 |
| Q2 | 0 | 7 |
| Q3 | 3 | 3 |
| Q4 | 14 | 6 |
| Total | 20 | 23 |
Arizona dominated the fourth quarter 14–6 and took a 20–20 lead with just 28 seconds left. Then Jason Myers stepped up and drilled a 52-yard field goal with 4 seconds on the clock. Season series: Seahawks 1–0.
Game 1 Scoring Plays — Seahawks vs Cardinals
| Time | Scoring Play | Score |
|---|---|---|
| Q1 4:41 | C. Ryland 33-yd FG | ARI 3–0 SEA |
| Q1 1:38 | S. Darnold → A. Barner 16-yd TD pass | ARI 3–6 SEA |
| Q1 1:33 | J. Myers extra point | ARI 3–7 SEA |
| Q2 1:07 | Z. Charbonnet 1-yd rushing TD | ARI 3–13 SEA |
| Q2 1:01 | J. Myers extra point | ARI 3–14 SEA |
| Q3 9:01 | J. Myers 44-yd FG | ARI 3–17 SEA |
| Q3 1:44 | C. Ryland 57-yd FG | ARI 6–17 SEA |
| Q4 9:37 | J. Myers 31-yd FG | ARI 6–20 SEA |
| Q4 5:55 | K. Murray → M. Harrison 16-yd TD | ARI 12–20 SEA |
| Q4 5:50 | C. Ryland extra point | ARI 13–20 SEA |
| Q4 0:33 | K. Murray → E. Demercado 7-yd TD | ARI 19–20 SEA |
| Q4 0:28 | C. Ryland extra point | ARI 20–20 SEA |
| Q4 0:04 | J. Myers 52-yd FG — WINNER | ARI 20–23 SEA |
The final play of this game — a 52-yard Jason Myers field goal through the uprights with 4 seconds remaining — is exactly the kind of moment that defines a season. Seattle held on. Arizona ran out of time.
Game 1 Team Stats: Cardinals vs Seahawks
| Category | SEA (Seahawks) | ARI (Cardinals) |
|---|---|---|
| Final Score | 23 | 20 |
| Total Yards | 384 | 253 |
| Passing Yards | 242 | 200 |
| Rushing Yards | 155 | 89 |
| First Downs | 20 | 18 |
| Avg Gain/Play | 6.0 | 4.0 |
| Turnovers | 1 | 2 |
| Interceptions Thrown | 0 | 2 |
| Sacks Taken | 3 | 6 |
| Sack Yards Lost | 13 | 36 |
| Completion % | 69.2% | 65.9% |
| Passer Rating | 111.4 | 73.2 |
| Rush Attempts | 35 | 17 |
| Rush Yards | 155 | 89 |
| Possession Time | 32:24 | 27:36 |
| Penalties | 6 | 7 |
| Penalty Yards | 74 | 46 |
| Field Goals Made | 3/4 | 2/2 |
| Touchdowns | 2 | 2 |
| Interceptions Taken | 2 | 0 |
Seattle outgained Arizona by 131 yards and owned the ball for nearly 5 extra minutes. The Cardinals’ 6 sacks and late fourth-quarter touchdowns turned this into a one-score game — but Seattle’s overall superiority showed throughout.
Game 1 Key Individual Performances
Seattle Seahawks — Offensive Highlights:
- Sam Darnold (QB): 18/26 completions (69.2%), 242 yards, 1 TD, 0 INT, 111.4 passer rating, 3 poor throws
- Zach Charbonnet (RB): Rushing touchdown in Q2, part of a 35-carry Seattle ground attack
- A. Barner (WR): Touchdown reception — 16 yards in Q1
- Seattle Defense: 6 sacks on Murray, 2 interceptions, 7 QB hits, 2 passes defended
Arizona Cardinals — Offensive Highlights:
- Kyler Murray (QB): 27/41 completions (65.9%), 200 yards, 2 TDs, 2 INTs, 73.2 passer rating, sacked 6 times
- M. Harrison (WR): 16-yard TD catch in Q4
- E. Demercado (WR/RB): 7-yard TD reception to tie the game with 28 seconds left
- C. Ryland (K): 57-yard field goal in Q3, perfect 2/2 on field goals
The story here was Kyler Murray’s resilience. He was sacked 6 times, lost 36 yards to sacks, and still threw for 2 fourth-quarter touchdowns to nearly steal the game.
Game 2 Full Breakdown — SEA 44 vs ARI 22
Date: November 9, 2025 | Venue: Lumen Field, Seattle, WA
Quarter-by-Quarter Scores — Game 2
| Quarter | SEA (Seahawks) | ARI (Cardinals) |
|---|---|---|
| Q1 | 21 | 0 |
| Q2 | 17 | 7 |
| Q3 | 0 | 8 |
| Q4 | 6 | 7 |
| Total | 44 | 22 |
Seattle scored 21 points in the first quarter alone. By halftime, it was 38–7. Arizona’s second-half numbers look decent in isolation, but the game was completely over before the third quarter started.
Game 2 Scoring Plays — Seahawks vs Cardinals
| Time | Scoring Play | Score |
|---|---|---|
| Q1 11:01 | S. Darnold → J. Smith-Njigba 43-yd TD | SEA 6–0 ARI |
| Q1 9:32 | Brissett fumble recovered by D. Lawrence — TD | SEA 13–0 ARI |
| Q1 1:28 | G. Holani 9-yd rushing TD | SEA 20–0 ARI |
| Q2 14:15 | Brissett fumble recovered by D. Lawrence — TD | SEA 27–0 ARI |
| Q2 8:38 | Z. Charbonnet 6-yd rushing TD | SEA 34–0 ARI |
| Q2 2:54 | G. Dortch 4-yd rushing TD | ARI 6–35 SEA |
| Q2 1:42 | J. Myers 46-yd FG | SEA 38–7 ARI |
| Q3 8:47 | J. Brissett → T. McBride 15-yd TD | SEA 38–13 ARI |
| Q3 8:42 | Two-point conversion: Brissett → M. Harrison | SEA 38–15 ARI |
| Q4 11:57 | J. Myers 32-yd FG | SEA 41–15 ARI |
| Q4 9:53 | J. Brissett → M. Harrison 9-yd TD | SEA 41–22 ARI |
| Q4 5:34 | J. Myers 34-yd FG | SEA 44–22 ARI |
D’Andre Lawrence recovered two Brissett fumbles and returned both for touchdowns. That single defensive player accounted for 14 points in the first 5 minutes of the game.
Game 2 Team Stats: Seahawks vs Cardinals
| Category | SEA (Seahawks) | ARI (Cardinals) |
|---|---|---|
| Final Score | 44 | 22 |
| Total Yards | 372 | 335 |
| Passing Yards | 178 | 258 |
| Rushing Yards | 198 | 129 |
| First Downs | 22 | 21 |
| Avg Gain/Play | 6.3 | 4.6 |
| Turnovers | 3 | 2 |
| Sacks Taken | 1 | 5 |
| Sack Yards Lost | 4 | 52 |
| Completion % | 83.3% | 48.9% |
| Passer Rating | 111.8 | 81.5 |
| Rush Attempts | 46 | 23 |
| Rush Touchdowns | 2 | 1 |
| Possession Time | 33:40 | 26:20 |
| Field Goals Made | 3/3 (100%) | 0/0 |
| Total Touchdowns | 5 | 3 |
| Passes Defended | 10 | 2 |
| QB Hits | 10 | 1 |
| Tackles for Loss | 10 | 5 |
Seattle’s defense suffocated Arizona’s passing attack. Brissett completed just 48.9% of his passes, was sacked 5 times for 52 yards, and took 10 QB hits. The Seahawks had zero punts — they scored or turned it over every single drive.
How Both Games Compare: Season Series Totals
| Category | SEA — Game 1 | ARI — Game 1 | SEA — Game 2 | ARI — Game 2 |
|---|---|---|---|---|
| Score | 23 | 20 | 44 | 22 |
| Total Yards | 384 | 253 | 372 | 335 |
| Sacks | 3 | 6 | 1 | 5 |
| Turnovers | 1 | 2 | 3 | 2 |
| Passer Rating | 111.4 | 73.2 | 111.8 | 81.5 |
| Rush Yards | 155 | 89 | 198 | 129 |
| Possession Time | 32:24 | 27:36 | 33:40 | 26:20 |
Seattle outgained Arizona in total yards in both games. The Seahawks controlled possession in both games. Sam Darnold posted a passer rating above 111 in both games — a remarkably consistent mark against the same opponent.
Sam Darnold vs Kyler Murray (and J. Brissett): Head-to-Head QB Stats
Game 1 — Sam Darnold vs Kyler Murray
| Category | Sam Darnold (SEA) | Kyler Murray (ARI) |
|---|---|---|
| Completions/Attempts | 18/26 | 27/41 |
| Completion % | 69.2% | 65.9% |
| Passing Yards | 242 | 200 |
| Touchdowns | 1 | 2 |
| Interceptions | 0 | 2 |
| Passer Rating | 111.4 | 73.2 |
| Sacks Taken | 3 | 6 |
| Poor Throws | 3 | 6 |
Game 2 — Sam Darnold vs Jarrett Brissett
| Category | Sam Darnold (SEA) | Jarrett Brissett (ARI) |
|---|---|---|
| Completions/Attempts | 10/12 | 22/45 |
| Completion % | 83.3% | 48.9% |
| Passing Yards | 178 | 258 |
| Touchdowns | 1 | 2 |
| Interceptions | 1 | 0 |
| Passer Rating | 111.8 | 81.5 |
| Sacks Taken | 1 | 5 |
| Fumbles | — | 2 (both returned for TDs) |
Darnold’s consistency across both games is the standout story in the full seahawks vs arizona cardinals match player stats. He posted an 111+ passer rating in both outings, threw 0 interceptions in the first contest, and completed over 83% of his passes in the rematch — on just 12 attempts while Seattle ran the ball 46 times.
What Defined Seattle’s Dominance in Both Games?
Three clear advantages show up across both sets of seahawks vs arizona cardinals match player stats:
1. Rushing Volume and Control Seattle ran the ball 35 times in Game 1 and 46 times in Game 2. Combined, that’s 81 rush attempts for 353 yards. Arizona rushed just 40 combined times for 218 yards. The Seahawks wanted to control the clock, wear down defenses, and they executed that plan perfectly both times.
2. Defensive Pressure on the Quarterback Seattle sacked Arizona QBs 6 times in Game 1 and 5 times in Game 2. That’s 11 combined sacks for 88 yards of lost yardage across the series. Arizona’s offensive line gave up QB hits, fumbles, and interceptions at a rate that made their offense look broken — especially in the second meeting.
3. Turnover Differential Arizona turned the ball over 4 times total across both games (2 in each). Seattle turned it over just 4 times total as well — but the timing and impact were radically different. Arizona’s turnovers directly produced points. Seattle’s turnovers were costly but contained.
Key Players Who Stood Out Across Both Games
Seattle Seahawks:
- Sam Darnold (QB) — 111+ passer rating in both games, 0 interceptions in Game 1, just 1 poor throw in Game 2
- Zach Charbonnet (RB) — Rushing touchdowns in both contests; Seattle’s interior threat
- Jason Myers (K) — Perfect field goal kicker across both games; his 52-yarder in Game 1 was the game winner
- D’Andre Lawrence (DL) — Two fumble return touchdowns in Game 2; the single most impactful defensive play of the series
- Jaxon Smith-Njigba (WR) — 43-yard TD catch in Game 2’s first series
Arizona Cardinals:
- Kyler Murray (QB) — Despite 6 sacks in Game 1, Murray threw 2 Q4 touchdowns to nearly steal the win
- Marvin Harrison Jr. (WR) — Multiple TD receptions across the series; Arizona’s most consistent red zone target
- Chad Ryland (K) — Hit a 57-yard field goal in Game 1; went 2/2 on field goals in the first meeting
- Trey McBride (TE) — 15-yard TD reception in Game 2’s third quarter
Where Does This Rivalry Fit in the NFC West Picture?
The Seattle Seahawks finished the 2025 season as NFC West champions, advancing all the way to Super Bowl LX where they defeated the New England Patriots 29–13 on February 8, 2026. The wins over Arizona were important regular-season building blocks for a team that found its identity early in the season.
These games confirmed a clear hierarchy in the NFC West: Seattle was built to run the ball, control the clock, and apply relentless defensive pressure. Arizona — transitioning between quarterbacks with Kyler Murray missing time and Jarrett Brissett stepping in — never found consistent footing against a Seattle defense that ranked among the most disruptive pass rushes in the conference.
According to Pro Football Reference, the Seahawks’ 2025 season ranks among the most complete team performances in franchise history, with balanced contributions on both sides of the ball.
2025 Seattle Seahawks Season Context
The seahawks vs arizona cardinals match player stats sit within a full-season run that included:
- A Week 3 blowout of the New Orleans Saints (44–13)
- A Sunday Night Football win over Washington (38–14)
- A 26–0 shutout of the Minnesota Vikings in November
- A 37–9 demolition of Atlanta in December
- A Divisional playoff win over San Francisco (41–6)
- A 31–27 NFC Championship victory over the LA Rams
That Super Bowl championship confirmed everything these regular-season performance numbers suggested: Seattle was the best team in the NFC all season long.
2025 Arizona Cardinals Season Context
Arizona faced a difficult stretch with Kyler Murray battling injury and Jarrett Brissett starting key games. Against Seattle specifically, the Cardinals:
- Lost by 3 in a game they nearly won (Game 1)
- Lost by 22 in a game that was over by halftime (Game 2)
- Gave up 11 combined sacks across both matchups
- Generated only 588 total yards against Seattle’s defense across both games
The Cardinals’ offense showed flashes — especially Murray’s fourth-quarter heroics in Game 1 — but the Seahawks’ defense consistently disrupted their rhythm before plays could develop.
FAQs: Seahawks vs Arizona Cardinals Match Player Stats
What was the final score of the Seahawks vs Cardinals Game 1 in 2025? The Seattle Seahawks won 23–20 in a Thursday Night Football game played at State Farm Stadium in Glendale on September 25, 2025. Jason Myers hit the game-winning 52-yard field goal with 4 seconds remaining after Arizona tied the game at 20–20 with 28 seconds left.
Who won the Seahawks vs Cardinals Game 2 in 2025? Seattle won convincingly, 44–22, at Lumen Field on November 9, 2025. The Seahawks led 38–7 at halftime after D’Andre Lawrence returned two Jarrett Brissett fumbles for touchdowns in the first quarter. Arizona scored 15 points in the second half, but the game was never in doubt.
What were Sam Darnold’s stats against the Arizona Cardinals in 2025? Darnold went 18/26 (69.2%) for 242 yards, 1 TD, 0 INTs, and a 111.4 passer rating in Game 1. In Game 2, he completed 10/12 passes (83.3%) for 178 yards, 1 TD, 1 INT, and a 111.8 passer rating. Both games produced outstanding efficiency numbers.
How many sacks did the Seahawks record against Arizona across both 2025 games? Seattle’s defense recorded 6 sacks (for 36 yards lost) in Game 1 and 5 sacks (for 52 yards lost) in Game 2. That’s 11 total sacks against Arizona QBs across the two-game series — a dominant performance by Seattle’s defensive line.
What was the seahawks vs arizona cardinals match player stat for rushing yards? In Game 1, Seattle rushed for 155 yards on 35 attempts. In Game 2, the Seahawks ran for 198 yards on 46 carries. Arizona managed 89 rush yards in Game 1 and 129 in Game 2. Seattle’s ground dominance was one of the defining patterns of both matchups.
Did the Seahawks sweep the Cardinals in 2025? Yes. Seattle won both regular-season meetings — 23–20 in Arizona and 44–22 at home. These wins were part of a Super Bowl–winning season for the Seahawks, who finished as NFC West champions and defeated the New England Patriots in Super Bowl LX on February 8, 2026.
The Complete Picture: What These Stats Prove
The full seahawks vs arizona cardinals match player stats across both 2025 games paint an unmistakable picture. Seattle was a more complete team in every way that matters — ground game, quarterback efficiency, defensive pressure, and clock management.
Game 1 was a close-call thriller settled by a clutch kicker. Game 2 was a statement game that exposed Arizona’s vulnerabilities when pressure came early and kept coming. Sam Darnold was efficient and accurate in both contests. Jason Myers was clutch when it counted. And Seattle’s defense turned Arizona’s turnovers into points before the Cardinals had time to establish any rhythm.
If you follow the NFC West, understanding these two matchups gives you a clear baseline for how both franchises performed in 2025 — and what the gap between them actually looked like when the final whistle blew.
Want Seattle’s full 2026 schedule, or a deeper breakdown of their Super Bowl run? Explore the complete stats and analysis from every game of the Seahawks’ championship season.