Opta Stats: The Complete Guide to Sports Data
Introduction
Sports fans love numbers. Goals, assists, tackles, passes—every statistic tells a piece of the story. But where do those numbers come from? Opta stats provide the backbone for most major sports coverage today. This guide explains what Opta is, how the data gets collected, and why teams, broadcasters, and bettors trust these numbers every single day.
What Are Opta Stats?
Opta stats refer to sports data collected, processed, and distributed by Opta Sports, a British company founded in 1996. Opta analyzes over 30 sports across more than 70 countries. Clients include leagues, broadcasters, betting websites, and professional teams. The company began by tracking Premier League matches for Sky Sports and quickly became the official statistics provider for the league itself. Today, Opta covers everything from football and basketball to cricket and rugby.
Each opta stats feed captures every on-ball action in a match. In football alone, Opta records over 60 distinct event types, including passes, shots, tackles, dribbles, and fouls. These events follow strict definitions to ensure consistency across thousands of matches each year.
How Opta Collects Live Data
Data collection happens in real time during every match. Skilled analysts sit at stadiums and record events as they occur. A typical football match generates over 1,600 individual pieces of information. At UEFA Euro 2000, Opta delivered live player data during a major tournament for the first time.
Three Tiers of Opta Data Feeds
| Feed Tier | What It Includes |
|---|---|
| Core Data | Basic match data, fixtures, results, league tables, live scores |
| Classic Data | Detailed player and team stats, cumulative data, text commentary |
| Performance Data | XY coordinates, timestamps, positional tracking, advanced metrics |
The table above summarizes the three Opta data feed tiers. Core feeds cover the basics for a wide range of competitions. Classic feeds add granular player statistics. Performance feeds provide the richest dataset, including real-time positioning data used by elite clubs for analysis.
Today, Opta collects roughly 13,000 core and player data points live for every match across hundreds of football games on a typical match day. With Opta Vision, AI combines XY tracking data with event data, generating nearly 3.8 million data points per match.
Opta Player Stats: Measuring Individual Performance
Opta player stats go far beyond simple goals and assists. Analysts record more than 60 distinct on-field actions for each player. These include successful and unsuccessful passes, shots on and off target, tackles won and lost, duels, dribbles, saves, clearances, blocks, and interceptions.
Opta Player Ratings
Opta Player Ratings evaluate performance using over 100 different metrics per player. The final score breaks down into six subcomponents: shooting, passing, defending, duels, dribbling, and goalkeeping (for keepers). This system provides a single number that represents a player’s overall contribution to a match.
Opta Points
Opta Points offer another proprietary metric that evaluates a player’s total game contribution. The scoring system distinguishes only between field players and goalkeepers, assigning points for actions such as goals, tackles, saves, and passes completed. This metric helps compare players across different positions and playing styles.
Player Radars
Opta Player Radars visualize multiple metrics in a single chart. Each slice of the radar represents a player’s percentile ranking compared to a benchmark dataset. For football, the benchmark includes 15 years of top five European leagues data, covering over 24,000 outfield player performances. A player rated in the 92nd percentile for chances created means they create more chances than 92% of forwards in the dataset.
Expected Goals (xG): The Advanced Metric That Changed Football
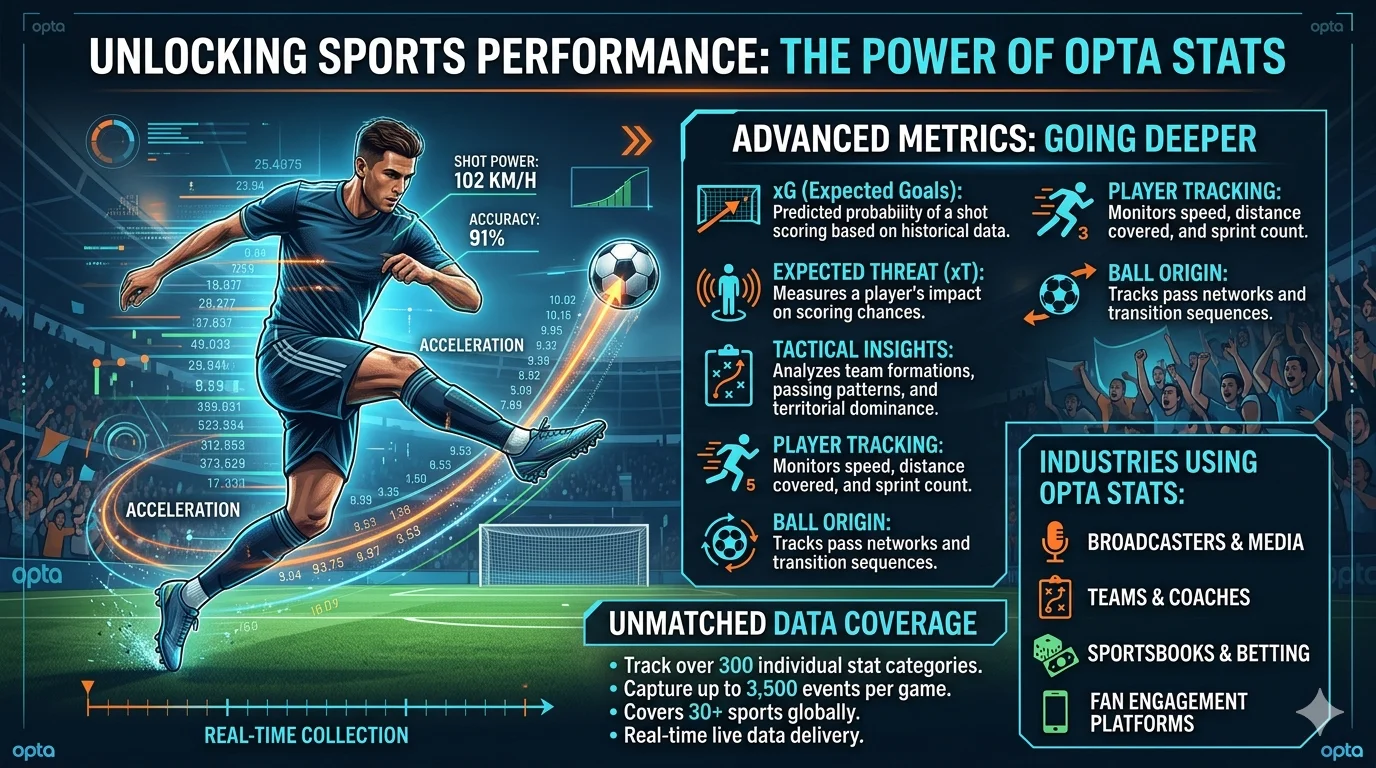
Opta introduced expected goals (xG) in 2012. The metric measures the quality of a chance by calculating the likelihood it will be scored. Opta uses nearly one million shots from its historical database to assign each shot an xG value between zero and one. A value of 0.1 means a player would be expected to score one goal from every ten shots of that type.
xG accounts for multiple factors: shot distance, angle, assist type, body part used, defensive pressure, and whether the chance came from open play or a set piece. In 2022, Opta released xG 2.0, which considers over 35 contextual factors, including goalkeeper position and shot clarity.
Today, xG appears regularly on major broadcasts such as BBC’s Match of the Day, Sky Sports, Bein Sports, and NBC.
Live Opta Stats for Broadcasters and Media
Live opta stats power modern sports broadcasting. Broadcasters use Opta data to generate on-screen graphics, post-match analysis, and real-time commentary. The Stats Perform partnership with Football DataCo means Opta exclusively collects official data for the Premier League, EFL, SPFL, and Scottish Women’s Premier League through at least 2024 and beyond.
Opta Live provides broadcasters with low-latency access to player, team, and league data through a live match dashboard. The platform automatically surfaces emerging storylines by analyzing live match events against decades of historical data. Features include automated insights, live play alerts, predictive metrics such as win probability, and interactive data visualizations like heat maps, shot charts, and passing grids.
Opta Stats in Sports Betting
Sportsbooks rely heavily on opta stats to set odds and settle bets. In January 2026, FIFA selected Stats Perform as its first official worldwide betting data distributor for all 104 matches of the 2026 World Cup and thousands of other FIFA competitions through 2029. Opta provides official player statistics, live scores, and match trackers exclusively to licensed betting operators.
Bookmakers use Opta data to create player prop bets on shots, passes, tackles, expected goals, fouls, goalkeeper saves, and cards. The accuracy of live data matters immensely for in-play betting markets, where odds change second by second. Opta has built a reputation as one of the few sports data brands recognized by fans and industry professionals alike.
Opta Vision: The Future of Football Analytics
Opta Vision represents the next generation of sports data. The system combines event data with XY tracking data for all 22 players on the pitch. This creates a synchronized dataset that captures every on-ball and off-ball action throughout a match. Opta Vision covers over 80 of the world’s leading competitions.
The tracking data generates over 2 million individual data points per game. Analysts can use this information to analyze high-intensity output, off-ball runs, pressure application, team shape in and out of possession, and line-breaking passes. Opta Vision also detects and categorizes attacking and defensive runs, providing insights that traditional event data alone cannot reveal.
Who Uses Opta Data?
The list of Opta clients reads like a who’s who of global sports.
- Leagues and federations – Premier League, EFL, SPFL, Major League Soccer, ICC, FIFA
- Broadcasters – Sky Sports, BBC, NBC, Bein Sports
- Professional clubs – Elite teams across football, rugby, cricket, and other sports
- Betting operators – Licensed sportsbooks worldwide
- Media outlets – Newspapers, websites, and apps delivering sports coverage
Opta’s parent company, Stats Perform, launched in 2019 after Vista Equity Partners acquired Perform Group and merged it with STATS LLC. The combined company holds over 7.2 petabytes of proprietary sports data, covering more than 3,900 competitions across 20+ sports.
How Opta Changed Sports Analytics Forever
Before Opta, sports statistics meant basic box scores. A football fan could see goals, assists, shots, and fouls—nothing more. Opta introduced the concept of event data. Every pass, tackle, and dribble became a data point. Analysts could suddenly measure things that never appeared on a traditional score sheet.
This shift changed how clubs scout players. A manager no longer relies solely on subjective opinions. They pull up opta player stats and compare hundreds of metrics across thousands of matches. Recruitment decisions now involve data scientists working alongside traditional scouts.
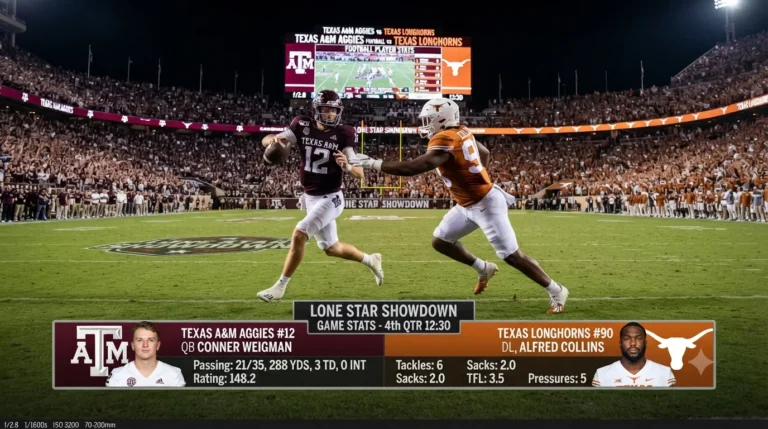
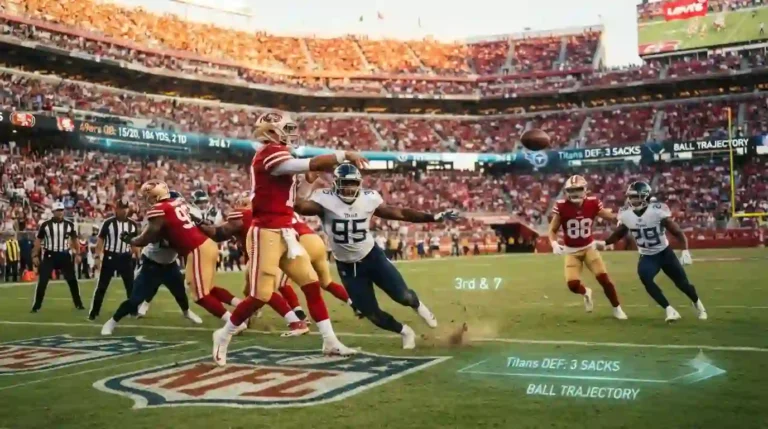
Broadcasters saw the opportunity too. On-screen graphics now show passing networks, heat maps, and expected goal totals. Commentators cite Opta stats to explain why a team deserved to win even when the scoreline says otherwise.
The betting industry also transformed. In-play betting markets require reliable, low-latency data. Opta provides that feed, allowing sportsbooks to offer bets on shots, passes, corners, and cards—all updated in real time.
The Future of Opta Data
Opta continues to push into artificial intelligence. OptaAI Studio generates automated insights for media partners. The company’s generative AI models produce continuous tracking data for players even when they move off-camera. This technology creates a complete picture of every player’s movement throughout a match. In 2024, Stats Perform launched OptaAI Studio, which powers advanced AI-driven insights for Football DataCo competitions.
Women’s sports represent a major growth area. Opta holds the deepest women’s football dataset in the market. As viewership and investment in women’s sports increase, Opta stands ready to provide the same level of detailed analysis that revolutionized men’s football.
The company also focuses on integrity services. Through its partnership with FIFA, Stats Perform provides monitoring support to protect competitions from betting-related corruption.
How Accurate Are Opta Stats?
Academic research has examined the reliability of opta stats. One study published in the International Journal of Performance Analysis in Sport found that the Opta Client System is reliable for collecting live football match statistics when operated by well-trained analysts.
Opta itself acknowledges that no data provider claims absolute accuracy. However, the company defends the accuracy and consistency of its Premier League data while noting that results are not guaranteed.
The data collection process combines human analysts with AI assistance. Most statistics are still manually entered by stat keepers at matches. AI helps record more precise information, such as pass type and distance covered, at faster rates. Some actions, such as clearances, remain difficult to record accurately due to their arbitrary nature.
OptaJoe: Bringing Stats to Fans
OptaJoe is the social media persona behind one of football’s most popular Twitter accounts. Run by statistician Duncan Alexander, OptaJoe has grown to over 700,000 followers. The account shares surprising stats, historical comparisons, and data-driven insights during live matches. Followers appreciate the blend of sharp analysis and dry humor. Alexander also authored “Outside the Box: OptaJoe’s 25 Years of the Premier League,” a book that uses Opta archives to uncover hidden truths and challenge accepted myths about the game.
Frequently Asked Questions (FAQs)
What does Opta stand for?
Opta does not officially stand for anything specific. The name was chosen as a brand for the company when it was founded in 1996. Some sources suggest it derives from “Optimal” or related terms, but the company primarily uses “Opta” as a standalone brand name.
How do Opta stats compare to other data providers?
Opta remains the most recognized sports data brand among fans, pundits, and media. Competitors include StatsBomb and various league-specific providers. However, Opta’s long history, official partnerships with major leagues, and extensive archive of over 7.2 petabytes of data set it apart. No other provider covers as many competitions or sports.
Can I access Opta stats for free?
Full access to Opta data requires a commercial license. However, fans can find Opta-powered statistics on websites such as the Premier League’s official site, BBC Sport, and the Stats Perform Opta Analyst platform. The Stats Zone mobile app provides deep match data using Opta feeds, though some features require a subscription.
What sports does Opta cover?
Opta covers over 20 sports, including football (soccer), American football, basketball, baseball, cricket, rugby union, rugby league, golf, handball, ice hockey, tennis, and volleyball. Football remains the deepest dataset, covering thousands of leagues and competitions worldwide.
How do Opta Vision and tracking data work?
Opta Vision uses computer vision technology to track all 22 players on the pitch simultaneously. The system captures XY coordinates for every player at 25 frames per second, generating over 2 million data points per match. Analysts can then study off-ball runs, pressure intensity, team shape, and line-breaking passes—elements that traditional event data misses entirely.
Where can I find the latest Opta stats for a specific match?
The fastest way is to use the Opta Analyst website (theanalyst.com), which provides match previews, live blogs, and post-match reports. For mobile users, the Stats Zone app offers live chalkboards, player comparisons, and event timelines. Broadcast partners such as Sky Sports and NBC also display Opta graphics during their coverage.
Final Word: Trust the Numbers
Opta stats have become the universal language of modern sports. From the Premier League to the World Cup, from your television screen to your betting app, Opta data shapes how you understand the game. The numbers come from a rigorous process—trained analysts, AI assistance, and decades of historical data—all working together to deliver accuracy and insight.
Next time you see a graphic showing a player’s pass completion rate or an expected goal tally, you will know where those numbers came from. You will know the system behind the stats. And you will appreciate just how much work goes into every single data point.
Want to explore Opta data for yourself? Visit the Opta Analyst website or download the Stats Zone app. Compare your favorite players, study match chalkboards, and impress your friends with stats they have never seen before.