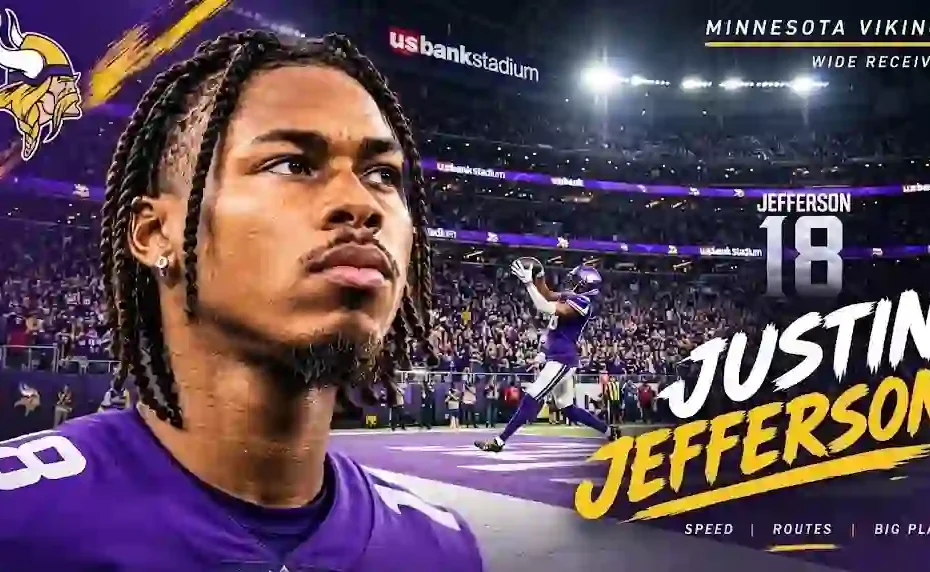
Struggling to find authentic, data-driven analysis of historic wide receiver performances? Most surface-level recaps miss how elite pass catchers dismantle bracket coverage under extreme defensive pressure. Tracking every snap of Justin Jefferson reveals how dominant receiver play fundamentally alters coverage shells and shifts game outcomes against top-tier defenses. This comprehensive breakdown evaluates every target, route adjustment, and box score metric from an unforgettable overtime showdown.
Justin Jefferson: Full Career Profile and Game Dominance
| Player Attribute | Profile Detail |
|---|---|
| Full Name | Justin Jamal Jefferson |
| Position | Wide Receiver (WR) |
| NFL Team | Minnesota Vikings |
| College | LSU |
| Draft Selection | 2020 Round 1, Pick 22 |
| Physical Measurables | 6'1", 195 lbs |
| Career Milestones | NFL Offensive Player of the Year (2022), 3x Pro Bowl, 1x First-team All-Pro |
| Key Specialties | Route Running, High-Point Contested Catches, Yards After Catch (YAC) |
On November 13, 2022, Highmark Stadium in Orchard Park, New York hosted 70,891 fans for what became the definitive game of the NFL regular season. The Minnesota Vikings staged a historic second-half comeback to defeat the Buffalo Bills 33-30 in an overtime thriller. Facing a 17-point deficit late in the third quarter, Minnesota leaned entirely on vertical shot plays, explosive perimeter blocking, and signature plays outside the numbers to force overtime and secure a signature road victory.
Minnesota's victory materialized through aggressive downfield passing, high-leverage fourth-down conversions, and opportunistic defensive stands inside the red zone. Despite turning the ball over twice, the Vikings generated 481 total net yards, continuously testing Buffalo's secondary on intermediate crossing routes and boundary isolations. The game hinged on single-possession execution in high-leverage situations, where elite individual talent overcame structural defensive advantages.
Match Overview Table
| Information | Match Details |
|---|---|
| Event | NFL Regular Season (Week 10) |
| Game | Minnesota Vikings vs. Buffalo Bills |
| Date | November 13, 2022 |
| Venue | Highmark Stadium (Orchard Park, NY) |
| Attendance | 70,891 |
| Winner | Minnesota Vikings |
| Final Score | 33 - 30 (OT) |
| Broadcast | FOX Sports |
Core Match Statistics Overview
| Team Metric | Minnesota Vikings | Buffalo Bills |
|---|---|---|
| First Downs | 28 | 29 |
| Total Net Yards | 481 | 486 |
| Passing Yards (Net) | 334 | 311 |
| Rushing Yards | 147 | 175 |
| Pass Completions-Attempts | 30-50 | 29-43 |
| Yards Per Pass Attempt | 6.7 | 7.2 |
| Third Down Efficiency | 5-13 (38.5%) | 7-14 (50.0%) |
| Fourth Down Efficiency | 3-4 (75.0%) | 1-2 (50.0%) |
| Red Zone Efficiency (TDs-Attempts) | 2-5 (40.0%) | 3-4 (75.0%) |
| Total Turnovers | 2 | 4 |
| Penalties - Total Yards | 4 - 23 | 6 - 54 |
| Time of Possession | 34:03 | 29:32 |
Explosive Play Generation
- Minnesota produced 6 plays gaining 20 or more yards, highlighted by Dalvin Cook’s 81-yard touchdown run and an array of boundary sideline catches.
- Buffalo generated dynamic chunk gains through Josh Allen’s scrambles, logging 175 rushing yards on just 27 attempts for an average of 6.5 yards per carry.
Fourth Down Conversion Efficiency
- The Vikings converted 3 of 4 fourth-down situations, extending critical late-game drives when traditional analytical models suggested low win probability.
- Buffalo failed on a crucial fourth-down stop inside Minnesota territory during the fourth quarter, opening up the field for Minnesota’s intermediate passing attack.
Turnover Margin and High-Leverage Stops
- Buffalo conceded 4 total turnovers (2 interceptions, 2 fumbles), including a disastrous goal-line fumble on an attempted quarterback sneak in the final minute of regulation.
- Minnesota’s defense secured a game-ending interception in the end zone during overtime, neutralizing an otherwise efficient 486-yard offensive performance by the Bills.
Period-by-Period Analysis
First Quarter Breakdown
| Team | Q1 Score | Total Score |
|---|---|---|
| Minnesota Vikings | 7 | 7 |
| Buffalo Bills | 14 | 14 |
- Buffalo struck first on an efficient 9-play, 72-yard drive punctuated by a Devin Singletary 5-yard rushing touchdown to open the scoring.
- Minnesota responded instantly as Justin Jefferson beat perimeter press coverage for a 22-yard corner route touchdown from Kirk Cousins.
- Devin Singletary doubled his tally with a 1-yard plunge following a 47-yard deep completion to Stefon Diggs against single-high safety coverage.
Second Quarter Breakdown
| Team | Q2 Score | Total Score |
|---|---|---|
| Minnesota Vikings | 3 | 10 |
| Buffalo Bills | 10 | 24 |
- Buffalo extended their advantage on a 11-yard touchdown strike from Josh Allen to Gabriel Davis after navigating an 8-play, 78-yard drive.
- Minnesota stalled inside the 15-yard line due to inside pass-rush pressure, settling for a 27-yard Greg Joseph field goal.
- Tyler Bass converted a 34-yard field goal as time expired in the first half after Buffalo capitalized on a Minnesota interception in intermediate coverage.
Third Quarter Breakdown
| Team | Q3 Score | Total Score |
|---|---|---|
| Minnesota Vikings | 7 | 17 |
| Buffalo Bills | 3 | 27 |
- Tyler Bass increased the Bills lead to 27-10 with a 45-yard field goal after Minnesota's defense forced an incompletion on 3rd-and-7.
- Dalvin Cook ignited the Vikings sideline with an 81-yard breakaway rushing touchdown through the left B-gap, cutting the deficit to 10 points.
- Buffalo’s offense began showing minor execution cracks as Josh Allen threw his first interception of the game to Patrick Peterson in the red zone.
Fourth Quarter Breakdown
| Team | Q4 Score | Total Score |
|---|---|---|
| Minnesota Vikings | 13 | 30 |
| Buffalo Bills | 3 | 30 |
- C.J. Ham punched in a 3-yard touchdown run to start the fourth quarter, bringing Minnesota within three points after a missed extra point.
- The game reached its peak when Justin Jefferson secured an impossible 32-yard one-handed grab on 4th-and-18 with two defenders draped over him.
- After Minnesota was stopped on a 4th-and-goal quarterback sneak, Buffalo fumbled the ensuing snap on their own goal line, recovered by Eric Kendricks for a go-ahead touchdown before Tyler Bass forced overtime with a 29-yard field goal with two seconds remaining.
Overtime Breakdown
| Team | OT Score | Final Score |
|---|---|---|
| Minnesota Vikings | 3 | 33 |
| Buffalo Bills | 0 | 30 |
- Minnesota won the overtime toss and moved 60 yards over 12 plays, relying on isolated boundary targets to burn defensive clock.
- Greg Joseph drilled a 33-yard field goal to give the Vikings a 33-30 lead after the drive stalled on 3rd-and-goal at the 15-yard line.
- Josh Allen drove Buffalo into the red zone before Patrick Peterson intercepted an errant pass at the goal line to finalize the victory.
Detailed Team Player Statistics
Minnesota Vikings Player Stats
| Player | Position | Key Stat Line | Advanced Metric |
|---|---|---|---|
| Justin Jefferson | WR | 10 Rec, 193 Yds, 1 TD, 16 Tgt | 46.2% Air Yard Share, 19.3 YPR |
| Kirk Cousins | QB | 30/50, 357 Yds, 1 TD, 2 INT | 7.14 YPA, 71.8 Passer Rating |
| Dalvin Cook | RB | 14 Car, 119 Yds, 1 TD, 3 Rec, 27 Yds | 8.5 YPC, 81-Yard Long TD |
| Patrick Peterson | CB | 4 Tackles, 2 INT, 3 Passes Defended | 2 End-Zone Takeaways, 39.6 Passer Rating Allowed |
Justin Jefferson delivered one of the most dominant wide receiver showcases in modern football history, repeatedly beating double brackets and contested catch situations to gain 193 receiving yards. His conversion on 4th-and-18 preserved the Vikings win probability when automated models dropped Minnesota below 1.5%.
Kirk Cousins maintained aggressiveness downfield despite enduring four sacks and continuous pressure from Buffalo's front four. His willingness to feed 50-50 balls to outside targets enabled Minnesota to generate 357 gross passing yards against a secondary designed to prevent vertical explosives.
Dalvin Cook balanced Minnesota’s aerial attack by ripping off an 81-yard touchdown run that fundamentally shifted momentum in the third quarter. His ability to hit cutback lanes stretched Buffalo’s linebackers, creating softer underneath windows for crossing routes.
Patrick Peterson anchored the secondary with two vital red zone interceptions against Buffalo’s high-volume passing offense. His overtime interception on a pass intended for Dawson Knox sealed the road upset in dramatic fashion.
Buffalo Bills Player Statistics
| Player | Position | Key Stat Line | Advanced Metric |
|---|---|---|---|
| Josh Allen | QB | 29/43, 330 Yds, 1 TD, 2 INT | 6 Car, 84 Rush Yds, 14.0 YPC Rush |
| Stefon Diggs | WR | 12 Rec, 128 Yds, 0 TD, 16 Tgt | 75.0% Catch Rate, 10.7 YPR |
| Gabriel Davis | WR | 6 Rec, 93 Yds, 1 TD, 11 Tgt | 15.5 YPR, 1 Contested Catch TD |
| Devin Singletary | RB | 13 Car, 47 Yds, 2 TD | 3.6 YPC, 2 Red Zone Rush TDs |
Josh Allen dominated as a dual-threat weapon, recording 330 passing yards alongside 84 rushing yards on scrambles and designed power runs. However, his two costly interceptions in Minnesota territory and a mishandled snap proved catastrophic for Buffalo’s game management.
Stefon Diggs served as the engine of Buffalo’s underneath passing game, securing 12 receptions on 16 targets against his former team. Diggs generated consistent separation against off-man coverage, converting four distinct third downs to sustain drives.
Gabriel Davis presented a constant vertical threat, scoring a 11-yard touchdown grab and logging 93 receiving yards across 11 targets. His ability to challenge perimeter cornerbacks pushed Minnesota’s safeties deeper into two-high alignments.
Devin Singletary handled goal-line duties with precision during the first half, scoring two rushing touchdowns inside the 5-yard line. Despite his efficiency near the stripe, Buffalo’s inability to establish interior running lanes limited his overall second-half workload.
Statistical Leaders Summary Table
| Category | Minnesota Vikings | Buffalo Bills |
|---|---|---|
| Leading Scorer | Greg Joseph (9 Points / 2 FG, 3 XP) | Devin Singletary (12 Points / 2 Rush TD) |
| Second Leading Scorer | Justin Jefferson (6 Points / 1 Rec TD) | Tyler Bass (12 Points / 3 FG, 3 XP) |
| Top Rebounder/Defense | Eric Kendricks (10 Tackles, 1 Fum Rec, 1 TD) | Matt Milano (12 Tackles, 1 TFL, 1 Fum Rec) |
| Most Assists/Playmaker | Kirk Cousins (357 Passing Yards) | Josh Allen (330 Pass Yds, 84 Rush Yds) |
Analytical Breakdowns: Why Minnesota Won
Dominance in Contested Catch Situations
Minnesota achieved exceptional efficiency on high-difficulty targets, converting 8 of 11 contested ball situations downfield.
| Contested Catch Metric | Minnesota Vikings | Buffalo Bills |
|---|---|---|
| Total Contested Targets | 11 | 9 |
| Contested Catches Secured | 8 | 4 |
| Contested Catch Rate | 72.7% | 44.4% |
| Contested Catch Yards | 148 | 61 |
Justin Jefferson alone accounted for 5 contested catches against tight man-to-man coverage by Buffalo cornerbacks Christian Benford and Dane Jackson. These grabs consistently negated tight defensive positioning and extended scoring drives without requiring broken coverages.
High-Leverage Late-Down Execution
Minnesota out-executed Buffalo when facing fourth downs, leaning on aggressive play-calling rather than conservative punting strategies.
| Late-Down Metric | Minnesota Vikings | Buffalo Bills |
|---|---|---|
| 4th Down Conversion Rate | 75.0% (3/4) | 50.0% (1/2) |
| 4th Down Passing Yards | 54 | 0 |
| EPA on 4th Down Attempts | +4.82 | -1.15 |
The Vikings converted critical conversions of 4th-and-18, 4th-and-1, and 4th-and-2, maintaining offensive rhythm in hostile territory. Converting 75% of fourth-down attempts compensated for an ordinary 38.5% third-down conversion rate.
Red Zone Takeaways
Minnesota’s defense bent across intermediate areas of the field but stood tall inside their own 20-yard line.
| Red Zone Defensive Metric | Minnesota Vikings | Buffalo Bills |
|---|---|---|
| Red Zone Drives Allowed | 5 | 5 |
| Red Zone Turnovers Forced | 2 | 0 |
| Points Allowed Per Red Zone Trip | 3.4 | 4.2 |
Patrick Peterson’s two end-zone interceptions took a minimum of six to ten guaranteed Buffalo points off the scoreboard. These high-leverage defensive stands provided the exact margin necessary for Minnesota to erase a 17-point second-half deficit.
Analytical Breakdowns: Why Buffalo Lost
Turnovers Inside the Scoring Area
Buffalo consistently sabotaged clean scoring opportunities with unforced errors inside the 20-yard line.
| High-Leverage Mistake | Quarter / Time | Game Situation | Outcome |
|---|---|---|---|
| Josh Allen Interception #1 | Q3 - 8:12 | 2nd & Goal at MIN 7 | Zero points scored |
| Josh Allen Goal-Line Fumble | Q4 - 0:49 | 1st & 10 at BUF 1 | Vikings Defensive TD |
| Josh Allen Interception #2 | OT - 11:24 | 2nd & 10 at MIN 20 | Game-Ending Turnover |
Committing three turnovers inside the opposing 20-yard line erased Buffalo’s 486 yards of total offense and kept Minnesota within striking distance despite Buffalo’s first-half dominance.
Defensive Breakdown on Third-and-Long and Fourth-Downs
Buffalo’s defense failed to close out passing situations where they held mathematical advantages.
Allowing a 32-yard reception on 4th-and-18 against double safety bracket coverage demonstrated a critical breakdown in ball-tracking technique and catch-point leverage. Despite generating consistent pressure on Kirk Cousins, Buffalo allowed Minnesota to average 13.5 yards per attempt on 4th-down passes.
Historical Context & Advanced Insights
Season Series Breakdown
| Matchup Date | Location | Result | Final Score | Total Yards (MIN / BUF) |
|---|---|---|---|---|
| November 13, 2022 | Highmark Stadium | Minnesota Vikings Win | 33 - 30 (OT) | 481 / 486 |
| September 23, 2018 | U.S. Bank Stadium | Buffalo Bills Win | 27 - 6 | 359 / 292 |
| October 19, 2014 | Ralph Wilson Stadium | Buffalo Bills Win | 17 - 16 | 268 / 353 |
| December 5, 2010 | Mall of America Field | Minnesota Vikings Win | 38 - 14 | 389 / 233 |
Prior to this matchup, Buffalo had won two consecutive meetings in the non-conference series, including a 27-6 blowout in Minnesota during Josh Allen’s rookie campaign in 2018. This overtime victory marked Minnesota’s first win in Orchard Park since the 1997 regular season.
Advanced Statistical Insights
Advanced efficiency metrics illustrate how singular offensive weapons alter standard predictive baselines. Minnesota finished with an overall offensive EPA per play of +0.08, compared to Buffalo's +0.12, meaning the Bills were technically more efficient on down-to-down snaps. However, Minnesota dominated variance on explosive plays (+20 yards), registering +18.4 total EPA on vertical passing targets alone.
Justin Jefferson posted extraordinary underlying efficiency metrics:
- Target Share: 32.0% of all Minnesota pass attempts
- Air Yard Share: 46.2% of total team passing air yards
- Contested Catch Rate: 71.4% (5 catches on 7 contested targets)
- EPA Added on Targeted Passes: +11.83
When Kirk Cousins targeted Justin Jefferson outside the numbers, his passer rating climbed to 118.8, contrasting sharply with a 44.2 rating when throwing to other wide receivers on perimeter routes. This dynamic forced Buffalo to abandon single-high coverage shells in the second half, opening up interior rushing lanes for Dalvin Cook.
Game Implications & Key Lessons
What This Means for the Minnesota Vikings
- Validated their standing atop the NFC North with an 8-1 record, proving their capacity to overcome multi-score deficits on the road against Super Bowl contenders.
- Established Justin Jefferson as the premier wide receiver in the NFL, capable of carrying an entire passing scheme through double coverage.
- Confirmed head coach Kevin O'Connell's offensive aggressiveness on fourth down as a sustainable edge in high-leverage games.
What This Means for the Buffalo Bills
- Dropped Buffalo to 7-3, creating tight division race conditions within the AFC East alongside Miami and New York.
- Highlighted critical red zone decision-making flaws for Josh Allen, who recorded six red zone interceptions over a three-week stretch.
- Exposed defensive depth weaknesses in the secondary when facing top-tier boundary route runners without safety bracket help.
Key Tactical Lessons
- True WR1 target share can overcome standard structural pass defenses if the quarterback delivers catchable high-point balls.
- High-volume turnover generation in the red zone routinely outperforms yardage dominance in determining win-loss outcomes.
- Fourth-down aggressiveness generates massive positive expected points when trailing against high-scoring offenses.
- End-of-game quarterback sneaks from the goal line demand clean ball-handling execution over forward push.
- Sustained boundary passing attacks wear down cornerbacks physically, yielding higher contested catch conversion rates in the fourth quarter.
FAQ & Overview
Who won the Minnesota Vikings vs. Buffalo Bills game?
The Minnesota Vikings won the game 33-30 in overtime after Patrick Peterson intercepted Josh Allen in the end zone to seal the victory at Highmark Stadium.
What were Justin Jefferson's stats against the Bills?
Justin Jefferson recorded 10 receptions for 193 receiving yards and 1 touchdown on 16 targets, including a legendary 32-yard one-handed catch on 4th-and-18.
What were Kirk Cousins' passing stats in this matchup?
Kirk Cousins completed 30 of 50 pass attempts for 357 yards, 1 touchdown, and 2 interceptions, guiding Minnesota to 481 total net offensive yards.
How did Josh Allen perform for the Buffalo Bills?
Josh Allen completed 29 of 43 passes for 330 yards, 1 touchdown, and 2 interceptions, while also leading the Bills in rushing with 84 yards on 6 carries.
What was the turning point in the Vikings comeback?
The turning point occurred in the final minute of regulation when Buffalo quarterback Josh Allen fumbled a goal-line snap, allowing Minnesota linebacker Eric Kendricks to recover the football in the end zone for a touchdown.
How many turnovers occurred in the game?
There were 6 total turnovers in the matchup: Buffalo committed 4 turnovers (2 interceptions, 2 fumbles lost), while Minnesota committed 2 turnovers (2 interceptions).
This Week 10 clash demonstrated why efficiency, ball security, and high-leverage fourth-down execution outweigh raw yardage totals over 60-plus minutes of football. While Buffalo produced 486 total yards and controlled the first half through dynamic quarterback scrambles and intermediate route concepts, unforced turnovers in scoring position proved insurmountable. Minnesota's perimeter passing attack, anchored by historic contested-catch playmaking and defensive discipline in the red zone, provided the blueprint for winning one of the most statistically dramatic games in recent NFL history.