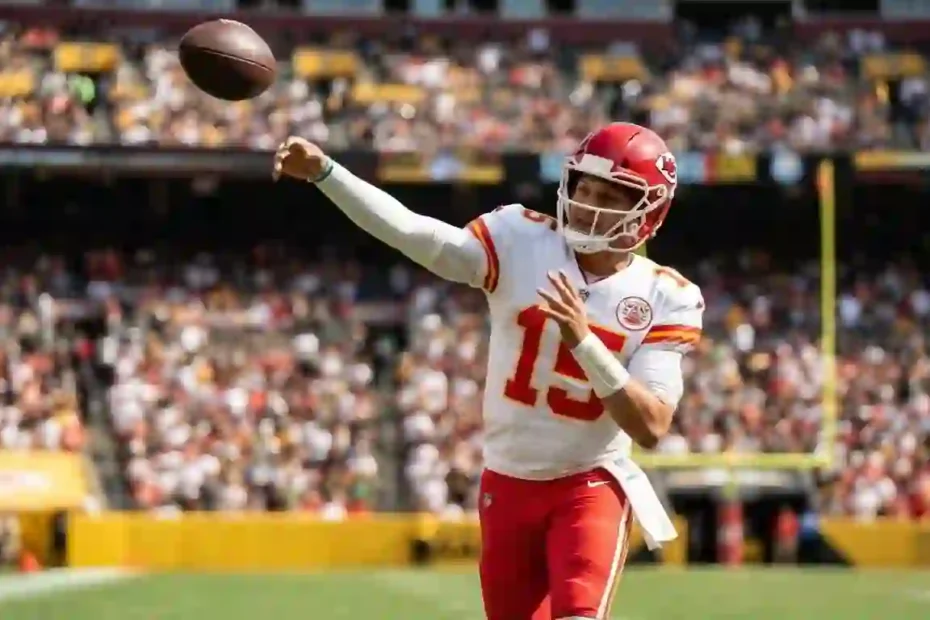
Patrick Mahomes Biography
Career snapshot at the end of Super Bowl LVIII on February 11, 2024. Honors below include this game.
| Biography Detail | Information |
|---|---|
| Full name | Patrick Lavon Mahomes II |
| Date of birth | September 17, 1995 |
| Birthplace | Tyler, Texas, United States |
| Age on game day | 28 |
| Sport and league | American football, National Football League |
| Team | Kansas City Chiefs |
| Position | Quarterback |
| Jersey number | 15 |
| Listed height and weight | 6 feet 2 inches; 225 pounds |
| High school | Whitehouse High School, Texas |
| College | Texas Tech University |
| NFL Draft | 2017, first round, 10th overall pick |
| Chiefs career began | 2017 |
| Full-time starting quarterback since | 2018 |
| AP NFL MVP awards through this game | Two: 2018 and 2022 seasons |
| Super Bowl championships through this game | Three: LIV, LVII and LVIII |
| Super Bowl MVP awards through this game | Three: LIV, LVII and LVIII |
Biographical information comes from Britannica and Football Database; listed measurements follow Football Database’s player profile.
Patrick Mahomes had a problem in Super Bowl LVIII: Kansas City’s offense had fallen ten points behind San Francisco. On February 11, 2024, before 61,629 fans at Allegiant Stadium in Las Vegas, wasted possessions threatened the Chiefs’ title defense.
The answer was situational execution, not uninterrupted dominance. A 25–22 overtime victory emerged from third-down conversions, quarterback rushing and special-teams interventions, capped by Mahomes’ touchdown pass to Mecole Hardman.
Match Overview
| Information | Match Details |
|---|---|
| Event | NFL championship game, Super Bowl LVIII, concluding the 2023 season |
| Game | Kansas City Chiefs vs. San Francisco 49ers |
| Date | February 11, 2024 |
| Venue | Allegiant Stadium, Las Vegas area, Nevada |
| Attendance | 61,629 |
| Winner | Kansas City Chiefs |
| Final Score | Kansas City Chiefs 25–22 San Francisco 49ers, overtime |
| Broadcast | United States: CBS; Paramount+ streaming; Nickelodeon alternate telecast; Univision Spanish-language coverage |
Game details follow the box score; broadcast information refers to the original U.S. coverage, not current replay availability.
Super Bowl LVIII Box Score: Core Team Statistics
Kansas City gained 73 more net yards and ran eight more offensive plays. That advantage did not come from winning every category: San Francisco held the ball longer, lost fewer yards to penalties and posted the higher red-zone touchdown percentage. The deciding question was which team could sustain possessions and finish the last one.
| Team Metric | Kansas City Chiefs | San Francisco 49ers |
|---|---|---|
| Total net yards | 455 | 382 |
| Offensive plays | 79 | 71 |
| Net yards per play | 5.76 | 5.38 |
| First downs | 24 | 23 |
| Team completions / attempts | 34/46 | 24/39 |
| Gross passing yards | 333 | 276 |
| Net passing yards | 325 | 272 |
| Rushing attempts | 30 | 31 |
| Rushing yards | 130 | 110 |
| Yards per rush | 4.33 | 3.55 |
| Third-down conversions | 9/19, 47.4% | 3/12, 25.0% |
| Fourth-down conversions | 1/1 | 1/1 |
| Red-zone touchdowns / trips | 2/6, 33.3% | 1/2, 50.0% |
| Giveaways | 2 | 2 |
| Sacks allowed / yards lost | 3/8 | 1/4 |
| Penalties / yards | 6/55 | 6/40 |
| Field goals | 4/4 | 3/3 |
| Time of possession | 36:26 | 38:31 |
All totals include overtime. Calculated rates are rounded; team net passing yards deduct sack yardage. San Francisco’s passing totals include Jauan Jennings’ 21-yard touchdown throw, not just Brock Purdy’s production.
Passing Accuracy and Volume
- The Patrick Mahomes Super Bowl stats show a 73.9% completion rate, compared with Purdy’s 60.5%; that is a 13.4-percentage-point gap between the starting quarterbacks.
- Kansas City accumulated 325 net passing yards, but San Francisco’s team average per pass play was slightly higher once sacks and Jennings’ throw were included. More passing yardage did not mean superiority under every efficiency definition.
Third-Down Execution
- Kansas City converted six more third downs, finishing 9-for-19 against San Francisco’s 3-for-12.
- The conversion-rate gap was 22.4 percentage points. Those extensions helped the Chiefs overcome a first half without an offensive touchdown.
Quarterback Rushing
- Mahomes supplied 66 of Kansas City’s 130 rushing yards: 50.8% of the team total.
- The remaining Chiefs rushers combined for 64 yards on 21 carries, only 3.05 per attempt. Mahomes’ mobility compensated for a ground game that was otherwise difficult to sustain. 1
Kicking and Red-Zone Returns
- Harrison Butker made all four field-goal attempts, while Jake Moody made all three of his. The separation was an additional made field goal, not a field-goal accuracy failure by Moody.
- Kansas City converted only two of six red-zone trips into touchdowns. Reliable kicking kept those missed touchdown opportunities from becoming a larger scoring deficit.
Quarter-by-Quarter and Overtime Analysis
First Quarter: San Francisco Moves the Ball but Leaves Points Behind
| Team | Quarter Points | Score After Quarter |
|---|---|---|
| Kansas City Chiefs | 0 | 0 |
| San Francisco 49ers | 0 | 0 |
- Christian McCaffrey’s opening-drive fumble erased a promising possession. Leo Chenal forced the ball loose, and George Karlaftis recovered at Kansas City’s 27-yard line.
- San Francisco collected seven first downs to Kansas City’s one. The 49ers established movement and territorial control without turning either into points.
- Mahomes managed only nine passing yards, while Chase Young recorded a four-yard sack. Kansas City punted after both of its opening-quarter possessions.
Second Quarter: A Trick-Play Touchdown Creates Separation
| Team | Quarter Points | Halftime Score |
|---|---|---|
| Kansas City Chiefs | 3 | 3 |
| San Francisco 49ers | 10 | 10 |
- Moody opened the scoring with a 55-yard field goal. Kansas City later wasted Hardman’s 52-yard reception when Isiah Pacheco lost a fumble deep in San Francisco territory.
- Jennings threw a 21-yard touchdown to McCaffrey with 4:23 remaining. The receiver-to-running-back connection pushed the 49ers ahead 10–0.
- Butker’s 28-yard field goal with 20 seconds left reduced the deficit to seven. San Francisco had prevented a first-half touchdown, but Kansas City remained within one possession.
Third Quarter: Defense and a Punt Recovery Flip the Game
| Team | Quarter Points | Score After Quarter |
|---|---|---|
| Kansas City Chiefs | 10 | 13 |
| San Francisco 49ers | 0 | 10 |
- Ji’Ayir Brown intercepted Mahomes on Kansas City’s opening second-half drive. San Francisco failed to capitalize, opening the half with three consecutive three-and-outs.
- Butker’s 57-yard field goal cut the margin to 10–6 and established the Super Bowl distance record at the time, surpassing Moody’s earlier 55-yarder.
- A Kansas City punt touched Darrell Luter Jr., and Jaylen Watson recovered at the San Francisco 16. Mahomes immediately found Marquez Valdes-Scantling for a touchdown, turning a short field into a 13–10 lead.
Fourth Quarter: Four Scoring Drives Leave the Teams Level
| Team | Quarter Points | Regulation Score |
|---|---|---|
| Kansas City Chiefs | 6 | 19 |
| San Francisco 49ers | 9 | 19 |
- Purdy’s 10-yard touchdown pass to Jennings restored San Francisco’s lead. Chenal blocked the extra point, keeping the advantage at 16–13 rather than four points.
- Butker answered from 24 yards, then Moody connected from 53 with 1:53 remaining. San Francisco led 19–16, forcing Kansas City to score again.
- Mahomes hit Travis Kelce for 22 yards on third-and-seven during the tying drive. Butker’s 29-yard kick with three seconds remaining sent the game to overtime at 19–19.
Overtime: Kansas City Finishes the Longer Scoring Assignment
| Team | Overtime Points | Final Score |
|---|---|---|
| Kansas City Chiefs | 6 | 25 |
| San Francisco 49ers | 3 | 22 |
- San Francisco received first and advanced 66 yards on its official 13-play scoring drive. Moody’s 27-yard field goal made it 22–19 with 7:22 remaining.
- Mahomes kept Kansas City alive with an eight-yard run on fourth-and-one. His later 19-yard scramble on third-and-one brought the Chiefs to the San Francisco 13.
- Mahomes completed all eight overtime passes for 42 yards and added 27 rushing yards. The 75-yard response ended with his three-yard touchdown pass to Hardman, with three seconds showing in the first overtime period.
Kansas City Chiefs Player Statistics
Patrick Mahomes Super Bowl Stats
| Metric | Performance |
|---|---|
| Passing | 34 completions, 46 attempts, 333 yards |
| Passing touchdowns / interceptions | 2/1 |
| Passer rating | 99.3 |
| Rushing | 9 carries, 66 yards |
| Longest rush | 22 yards |
Mahomes solved two different problems: he supplied passing volume while also generating rushing production that Kansas City’s other ball carriers could not match. His fourth-down keeper and third-down scramble in overtime converted defensive stops into fresh opportunities, making his rushing line essential rather than incidental to the win.
Travis Kelce Receiving Stats
| Metric | Performance |
|---|---|
| Targets / receptions | 10/9 |
| Receiving yards | 93 |
| Receiving touchdowns | 0 |
| Longest reception | 22 yards |
Kelce finished the first half with one catch for one yard, then added eight catches for 92 yards after halftime, including overtime. His late 22-yard reception supplied the field position for the tying kick, showing why a scoreless receiving line can still contain one of a game’s most important plays.
Mecole Hardman: Explosive Gain and Winning Touchdown
| Metric | Performance |
|---|---|
| Targets / receptions | 3/3 |
| Receiving yards | 57 |
| Receiving touchdowns | 1 |
| Longest reception | 52 yards |
Hardman’s 52-yard catch created an early scoring opportunity, although Pacheco’s subsequent fumble prevented Kansas City from collecting points. His winning reception was only three yards, but it completed the game’s most valuable drive and demonstrated the difference between a play’s length and its competitive importance.
Harrison Butker: Thirteen Points Without a Miss
| Metric | Performance |
|---|---|
| Field goals | 4/4 |
| Successful distances | 28, 57, 24 and 29 yards |
| Extra points | 1/1 |
| Individual points scored | 13 |
Butker supplied more than half of Kansas City’s 25 points and converted chances from both short and extended range. His performance allowed an offense with repeated red-zone stalls to remain competitive until it finally produced the winning touchdown.
Supporting production also mattered: Pacheco added 59 rushing yards and 33 receiving yards, Rashee Rice caught six passes for 39 yards, and Justin Watson supplied three receptions for 54 yards. Valdes-Scantling caught three passes for 20 yards and scored Kansas City’s first touchdown, while Nick Bolton led the Chiefs with 13 combined tackles.
San Francisco 49ers Player Statistics
Brock Purdy Super Bowl Stats
| Metric | Performance |
|---|---|
| Passing | 23 completions, 38 attempts, 255 yards |
| Passing touchdowns / interceptions | 1/0 |
| Passer rating | 89.3 |
| Rushing | 3 carries, 12 yards |
Purdy avoided an interception and helped San Francisco score on its final three substantive offensive possessions, excluding the kneel-down that ended regulation. His limitation was not catastrophic turnover damage but an inability to consistently extend possessions against Kansas City’s third-down defense.
Christian McCaffrey: 160 Yards From Scrimmage
| Metric | Performance |
|---|---|
| Rushing | 22 carries, 80 yards |
| Receiving | 8 catches on 8 targets, 80 yards |
| Receiving touchdowns | 1 |
| Total scrimmage yards | 160 |
| Fumbles lost | 1 |
McCaffrey led San Francisco in both rushing and receiving yardage, turning every target into a completion and giving Purdy a dependable outlet. Yet his 3.64 yards per carry limited the ground game’s consistency, and the opening-drive fumble erased an early chance to establish a scoring advantage.
Jauan Jennings: Touchdown Production in Two Roles
| Metric | Performance |
|---|---|
| Receiving | 4 catches on 5 targets, 42 yards |
| Receiving touchdowns | 1 |
| Passing | 1 completion, 1 attempt, 21 yards |
| Passing touchdowns | 1 |
Jennings contributed to both San Francisco touchdowns, first as the passer and later as the receiver. His production gave the offense an alternative to its primary stars, but two touchdown involvements could not compensate for stalled drives elsewhere.
Fred Warner: High Defensive Workload
| Metric | Performance |
|---|---|
| Combined tackles | 13 |
| Solo tackles | 9 |
| Assists | 4 |
Warner matched Bolton’s combined tackle total while San Francisco defended 79 offensive plays. That workload illustrates why tackle totals need context: frequent involvement did not prevent Kansas City from converting nine third downs or completing its final touchdown drive.
Chiefs vs 49ers Player Stats: Statistical Leaders
| Category | Kansas City Chiefs | San Francisco 49ers |
|---|---|---|
| Leading scorer | Harrison Butker, 13 points | Jake Moody, 10 points |
| Second-leading scorer | Mecole Hardman and Marquez Valdes-Scantling, 6 each | Christian McCaffrey and Jauan Jennings, 6 each |
| Most combined tackles | Nick Bolton, 13 combined | Fred Warner, 13 combined |
| Primary passing playmaker | Patrick Mahomes, 333 yards and 2 TD passes | Brock Purdy, 255 yards and 1 TD pass |
| Leading rusher | Patrick Mahomes, 66 yards | Christian McCaffrey, 80 yards |
| Leading receiver | Travis Kelce, 93 yards | Christian McCaffrey, 80 yards |
These are NFL scoring totals: a touchdown pass is credited to the quarterback’s passing statistics, but the six scoring points belong to the player who scores the touchdown. Jennings therefore scored six individual points, not twelve, despite throwing one touchdown and catching another. Kansas City did not attempt an extra point after its game-ending touchdown.
Why the Kansas City Chiefs Won
More Third-Down Conversions Created More Opportunities
| Measure | Chiefs | 49ers |
|---|---|---|
| Third downs converted | 9 | 3 |
| Third-down success rate | 47.4% | 25.0% |
| Offensive plays | 79 | 71 |
Kansas City repeatedly bought another set of downs rather than depending on a single explosive sequence. The connection between conversion success and play volume matters: extending drives creates additional chances to gain yards and reach scoring range, even when average gains are not overwhelming.
Quarterback Runs Offset Ordinary Backfield Efficiency
| Rushing Measure | Chiefs | 49ers |
|---|---|---|
| Quarterback rushing yards | 66 | 12 |
| Non-quarterback rushing yards | 64 | 98 |
| Total rushing yards | 130 | 110 |
San Francisco gained 34 more rushing yards through players other than its quarterback. Mahomes reversed that advantage with a 54-yard edge over Purdy on the ground, leaving Kansas City ahead by 20 rushing yards overall. This was not conventional running-back dominance; it was a quarterback changing the structure of the rushing comparison.
Special Teams Changed Both Points and Field Position
| Special-Teams Measure | Chiefs | 49ers |
|---|---|---|
| Field goals made | 4 | 3 |
| Kicker points | 13 | 10 |
| Extra points blocked against them | 0 | 1 |
| Punt-return possessions lost | 0 | 1 |
The punt recovery supplied Kansas City with a 16-yard touchdown field. Chenal’s extra-point block also preserved a three-point deficit in the fourth quarter, keeping a field goal sufficient to tie at that stage. Neither play explains the entire result alone, but both altered what the offense needed to accomplish next.
Chiefs Overtime Win: Eight Completed Passes
| Overtime Measure | Chiefs | 49ers |
|---|---|---|
| Completions / attempts | 8/8 | 4/6 |
| Quarterback rushing yards | 27 | 0 |
| Points | 6 | 3 |
Mahomes did not need a deep completion to win the extra period. He distributed eight completions among five receivers, accepted short gains and added two first-down runs; Kansas City combined those contributions into a touchdown rather than another field goal.
Why the San Francisco 49ers Lost
The Third-Quarter Reset Failed
San Francisco’s first three possessions after halftime ended in three-and-outs. The first began at Kansas City’s 44-yard line after Brown’s interception, yet the 49ers could not turn that favorable starting position into points. Their defense had delivered an opportunity to extend the lead; their offense returned the ball without changing the score.
Important Targets Produced Too Little Yardage
| Receiver | Targets | Receptions | Receiving Yards |
|---|---|---|---|
| Deebo Samuel | 11 | 3 | 33 |
| George Kittle | 3 | 2 | 4 |
| Combined | 14 | 5 | 37 |
Samuel and Kittle combined for only 2.64 yards per target. That does not assign all responsibility to the receivers—coverage, pass placement and route design influence the outcome—but it identifies where San Francisco’s passing game failed to produce returns. McCaffrey’s perfect eight-for-eight target conversion could not make every other passing option efficient.
The Overtime Red-Zone Stop Left the Door Open
San Francisco reached second-and-four at Kansas City’s nine-yard line in overtime. McCaffrey was stopped for no gain, then Chris Jones pressured Purdy into an incompletion on third down. Moody’s field goal secured a lead, but not a lead that could survive an opposing touchdown. The decisive failure was finishing that possession with three points and then failing to stop Kansas City’s response.
Historical Context and Advanced Statistical Insights
Season Series Breakdown
These teams did not meet during the 2023 regular season. Super Bowl LVIII was their only matchup in that season’s regular-season and postseason schedule, so there is no earlier 2023 meeting to insert into the series.
| Season Stage | Date | Matchup Result |
|---|---|---|
| 2023 regular season | No meeting | Not applicable |
| 2023 postseason: Super Bowl LVIII | February 11, 2024 | Chiefs won 25–22 in overtime |
For earlier rivalry context—not the 2023 season series—Kansas City won the October 23, 2022 meeting 44–23 and defeated San Francisco 31–20 in Super Bowl LIV. The LVIII victory also made the Chiefs the first repeat Super Bowl champions since the New England Patriots’ 2003 and 2004 championship seasons.
Passing Volume and Passing Efficiency Tell Different Stories
| Calculated Efficiency Metric | Chiefs | 49ers |
|---|---|---|
| Starting QB gross yards per attempt | 7.24 | 6.71 |
| Team net yards per pass play, including sacks | 6.63 | 6.80 |
| Team net yards per offensive play | 5.76 | 5.38 |
The first row compares Mahomes with Purdy. The second compares entire passing units: Kansas City’s 325 net passing yards divided by 49 pass plays, against San Francisco’s 272 divided by 40. Jennings’ touchdown pass is included in San Francisco’s team figure. These are calculations from box-score totals, not expected-points-added estimates.
This distinction prevents a misleading claim that Kansas City dominated every passing-efficiency measure. The Chiefs’ broader advantage combined more plays, better overall yards per snap and additional quarterback rushing value. Volume and efficiency worked together; neither number alone explains the final score.
Pressure Matters Even When It Does Not Produce a Sack
Kansas City recorded only one sack, compared with San Francisco’s three. Yet NFL Next Gen Stats, as reported by NFL.com, credited Jones with six quarterback pressures and the Chiefs with nine unblocked pressures, all generated on blitzes. Nick Bosa, meanwhile, generated ten pressures on 48 pass rushes for San Francisco.
The lesson is not that sacks lack value. It is that the sack column omits hurried throws and disrupted decisions, including Jones’ overtime pressure. Kansas City affected a scoring opportunity without recording a sack on the play, while San Francisco’s pressure production could not prevent Mahomes’ final drive.
Red-Zone Percentages Need Their Denominators
San Francisco’s 50.0% red-zone touchdown rate exceeded Kansas City’s 33.3%, but the underlying counts were one touchdown from two trips versus two from six. The Chiefs reached that area more frequently; the 49ers’ other touchdown came on Jennings’ 21-yard pass, outside the red zone.
A percentage describes conversion within a defined set of opportunities. It does not describe how many opportunities a team created, where other scores originated or how successfully a kicker recovered points from stalled drives. All three distinctions matter in this game.
The Overtime Clock Was Not a Sudden-Death Deadline
Hardman scored with three seconds remaining in the first overtime period, but Kansas City did not have to finish its initial possession before that period expired. Under the postseason rules applicable to this game, an unfinished second team’s opening possession would continue into another overtime period. The urgent requirement was avoiding a possession-ending failure while trailing—not beating the first overtime clock.
Game Implications and Key Lessons
What This Meant for Kansas City
- A repeat championship: Kansas City secured consecutive Super Bowl wins and its third title in five seasons.
- Another individual milestone: Mahomes earned his third Super Bowl MVP award, tying Joe Montana’s total at the time and trailing Tom Brady’s five.
- A clear improvement area despite victory: Two touchdowns from six red-zone trips showed that winning did not eliminate the offense’s finishing problems.
What This Meant for San Francisco
- Possession extension needed attention: A 25.0% third-down conversion rate was insufficient against a quarterback capable of manufacturing additional chances.
- Special-teams execution demanded review: The lost punt-return possession and blocked extra point changed both field position and late-game scoring requirements.
- Late-down defense remained the final barrier: Kansas City’s overtime fourth-down keeper and subsequent third-down conversions exposed the need to defend quarterback movement alongside receiving options.
Six Practical Lessons From the Match
- Read totals alongside game situation: Chiefs vs 49ers player stats show why identical giveaway totals can conceal very different field-position consequences.
- Value dependable targets: Travis Kelce receiving stats—nine catches on ten targets—demonstrate the value of turning available throws into completed gains.
- Include the quarterback in run-defense planning: Scrambles and designed keepers can rescue an otherwise limited rushing attack.
- Compare rates with opportunity counts: A better red-zone percentage is not automatically a more productive scoring performance.
- Evaluate pressure beyond sacks: A forced incompletion can determine whether an opponent finishes with three points or seven.
- Prepare for the actual overtime rules: Players and coaches need to distinguish possession requirements from the expiration of an individual period.
Frequently Asked Questions
Who won Super Bowl LVIII?
The Kansas City Chiefs defeated the San Francisco 49ers 25–22 in overtime on February 11, 2024, at Allegiant Stadium.
What were Patrick Mahomes’ Super Bowl LVIII statistics?
Mahomes completed 34 of 46 passes for 333 yards, two touchdowns and one interception. He also rushed nine times for 66 yards and finished with a 99.3 passer rating.
Who finished the game with the most points?
Harrison Butker led all players with 13 points from four field goals and one extra point. San Francisco’s Jake Moody scored ten points.
What were Travis Kelce’s receiving statistics?
Kelce caught nine of ten targets for 93 yards, with a longest reception of 22 yards. He did not score a touchdown.
How did Brock Purdy perform against the Chiefs?
Purdy completed 23 of 38 passes for 255 yards, one touchdown and no interceptions. His passer rating was 89.3, and he added 12 rushing yards.
Who caught the winning touchdown, and who was MVP?
Mecole Hardman caught Mahomes’ three-yard touchdown pass to end overtime. Mahomes received the Super Bowl LVIII MVP award, the third of his career.
Conclusion
Patrick Mahomes supplied the defining finish, but Kansas City won through connected execution: receivers converted targets, quarterback runs extended possessions, defensive pressure limited late scoring and Butker preserved points. San Francisco received major individual contributions from McCaffrey and Jennings without matching that situational consistency. The Chiefs did not lead every efficiency category; they combined the right efficiencies with collective execution when winning outright required a touchdown rather than another field goal.